Using the App — Manager
Managers review trends and comparisons across an organisation. A manager looks above a single school — at an organisation made of schools — to follow follow-up needs over time and compare schools by status distribution. Amal is explicit that there is no preferential ranking between schools: comparison is about patterns, not league tables.
Organisation overview
The overview is the manager’s home: high-level counts for the organisation — schools, students, and how many need follow-up — alongside a card per school.
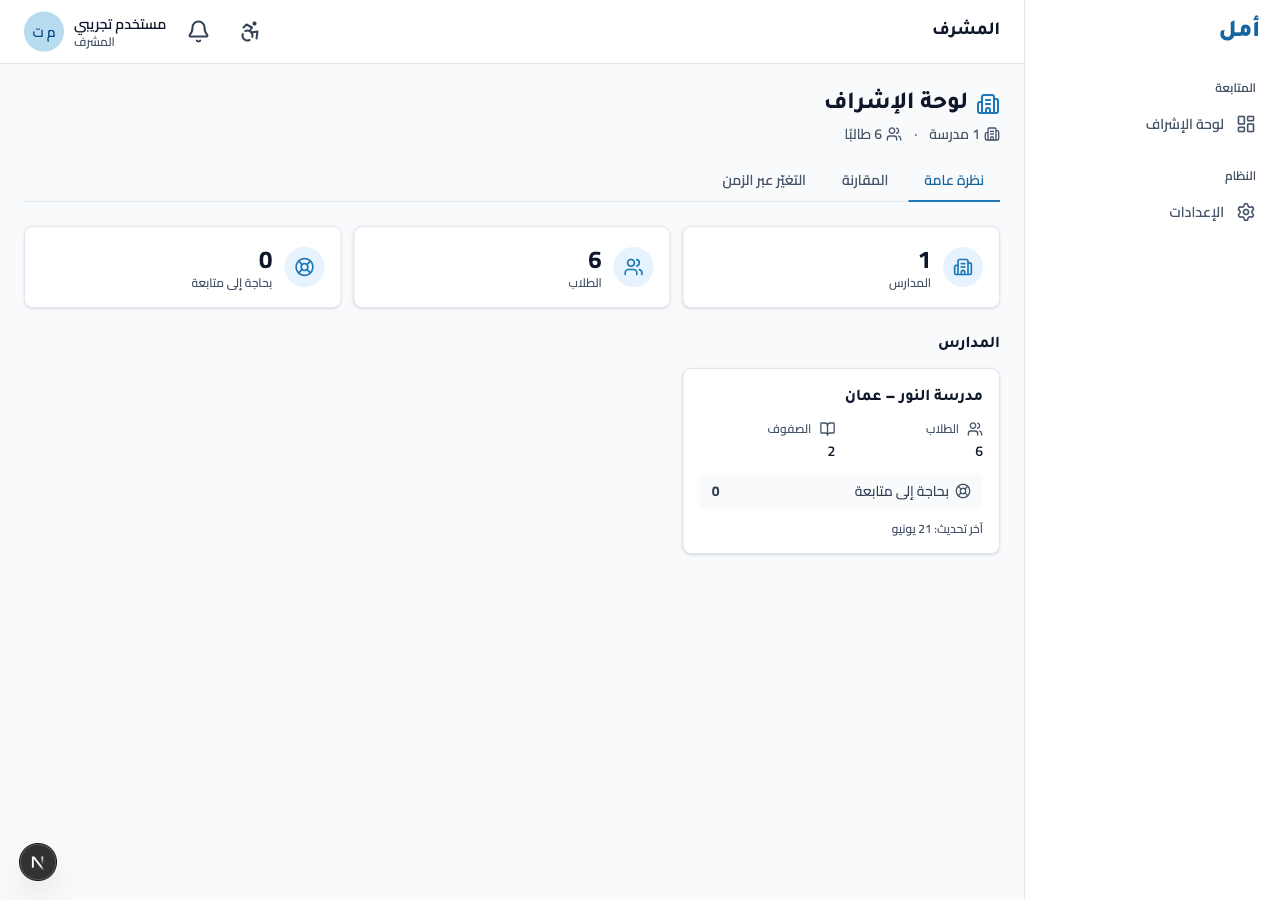
How to:
- Read the headline counts for the organisation (schools, students, follow-up needs).
- Review the per-school cards.
- Use the view links to move to trends and comparisons.
Trends
The trends screen tracks per-school follow-up counts across assessment windows, by domain. A row of domain pills lets you switch the domain in focus.
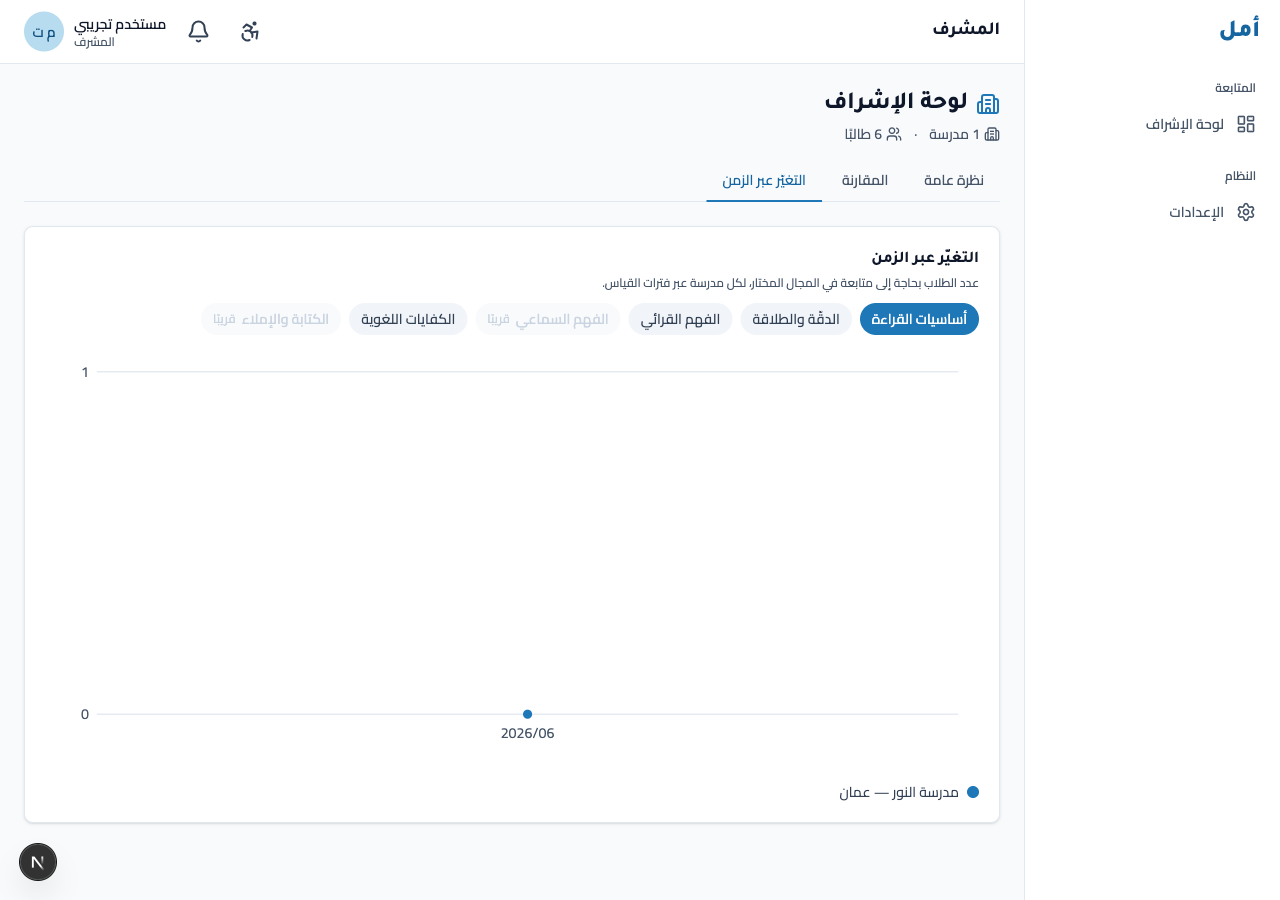
How to:
- Click a domain pill to change the domain shown in the chart.
- Read follow-up counts per school across the windows.
Two domains (Listening, Writing/Spelling) are marked coming soon — these are honest Wave-1 scope markers, not missing data.
Comparisons
The comparisons screen shows the per-domain status distribution across schools. It states plainly that there is no preferential ranking between schools — it is a distribution view, not a ranking.
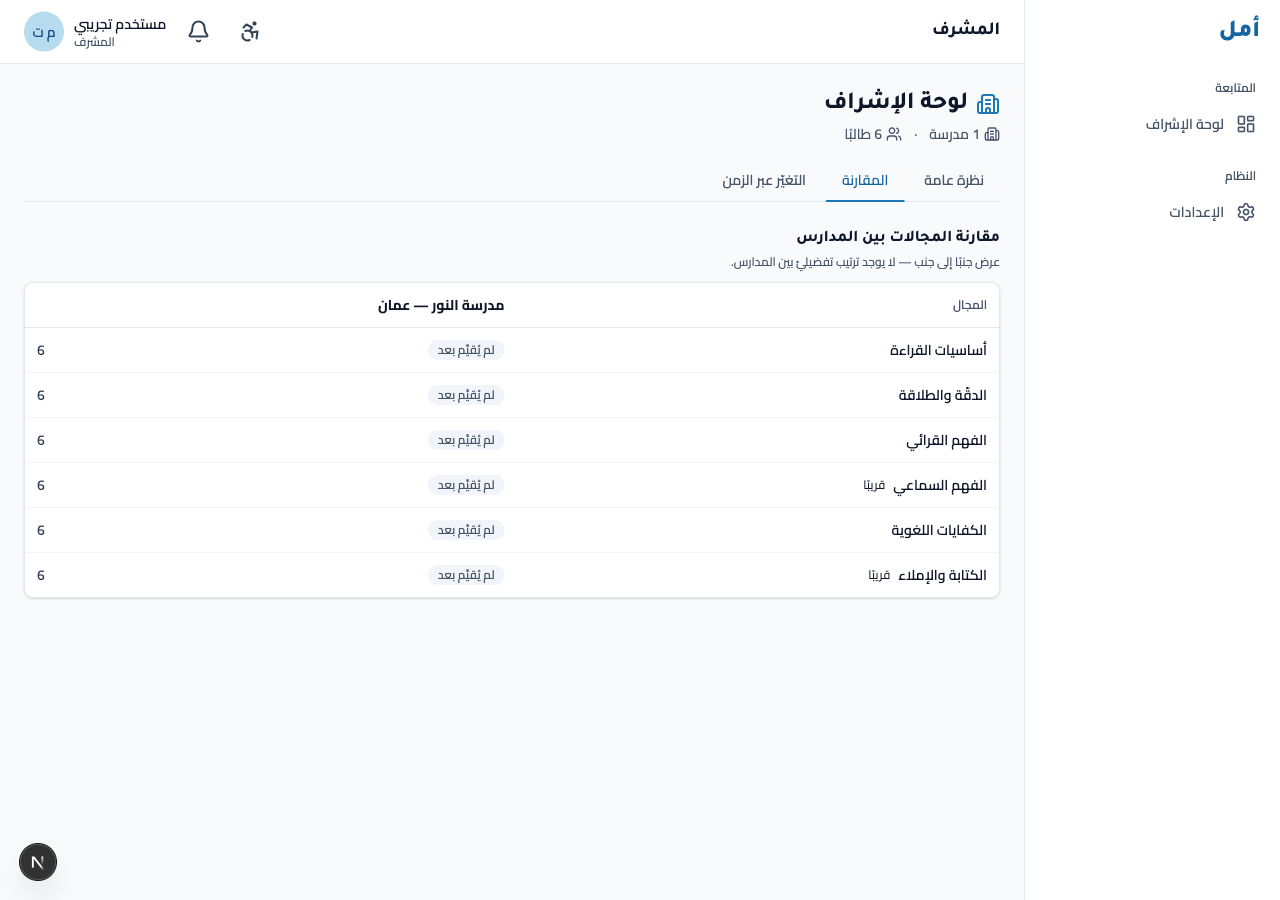
How to:
- Read each domain’s status distribution across the schools.
- Note the explicit “no preferential ranking between schools” framing — this is a comparison of patterns, not a contest.
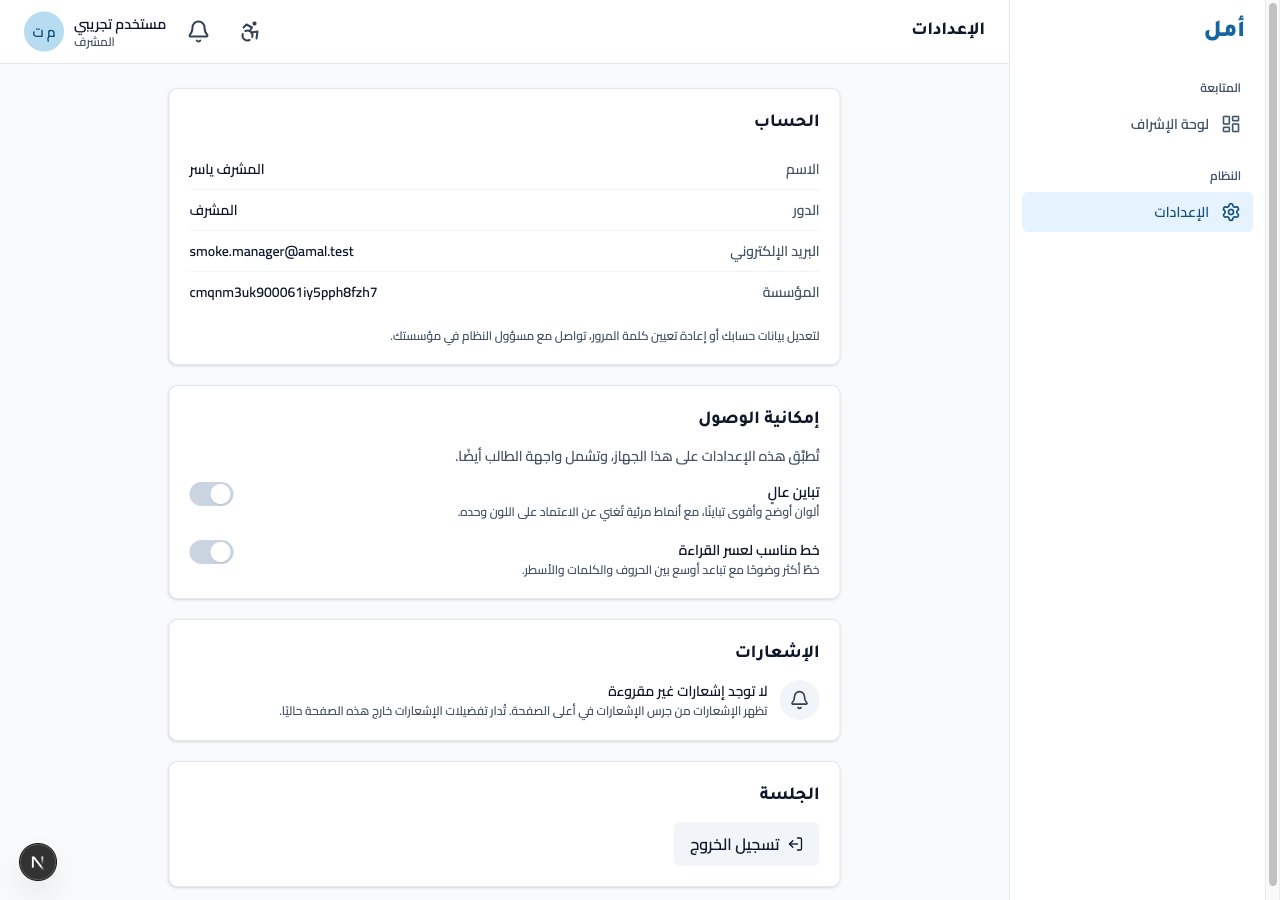
Settings
The settings screen holds your account, accessibility toggles (including high-contrast), notifications, and session controls.
On phone and tablet
- On a wide screen a navigation rail sits on the right.
- On a phone you navigate from a bottom bar; wide content (charts and the comparisons table) sits inside a contained horizontal-scroll area, so the page itself never overflows.
No surface ever shows a single overall percentage — overviews are counts, trends are follow-up counts, and comparisons are status distributions.