Using the App — Principal
Principals review the health of one school. A principal sees the whole school at a glance — macro-domain status, class health, and growth over time — all at the status level, never as a single overall percentage. The view is read-only: principals review, teachers decide.
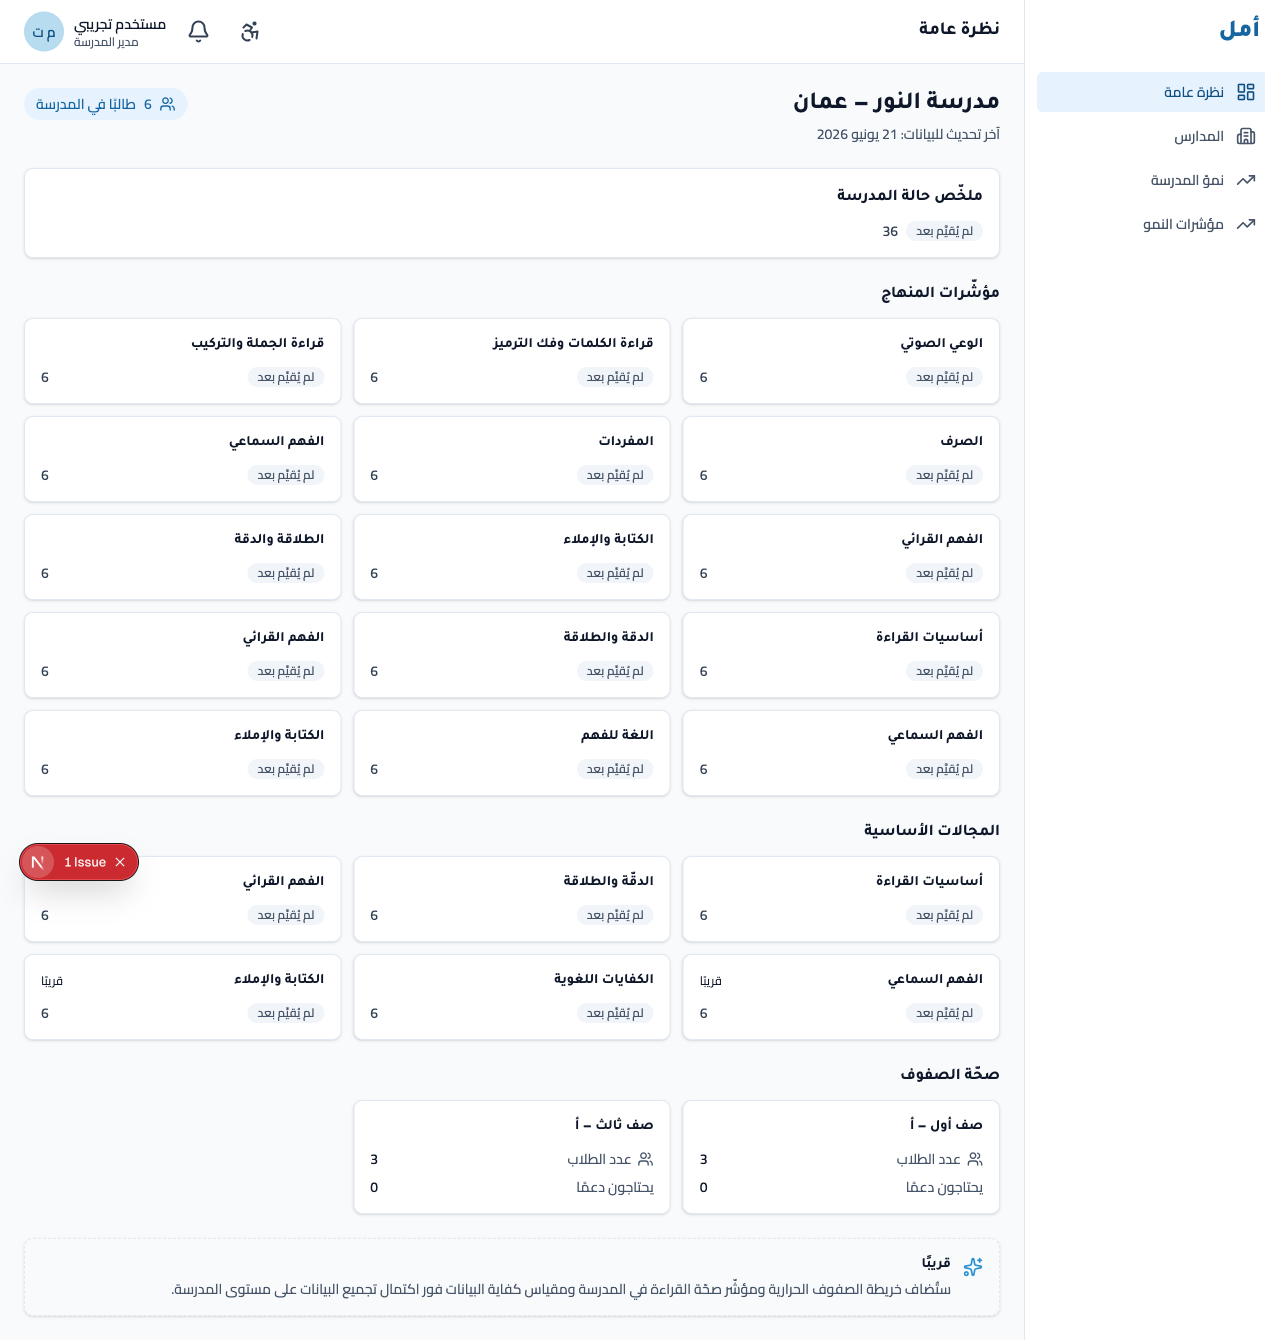
School overview
The overview is the principal’s home: a curriculum picture, a six-tile macro-domain grid, and class-health counts. Statuses are shown per measure and per macro domain.
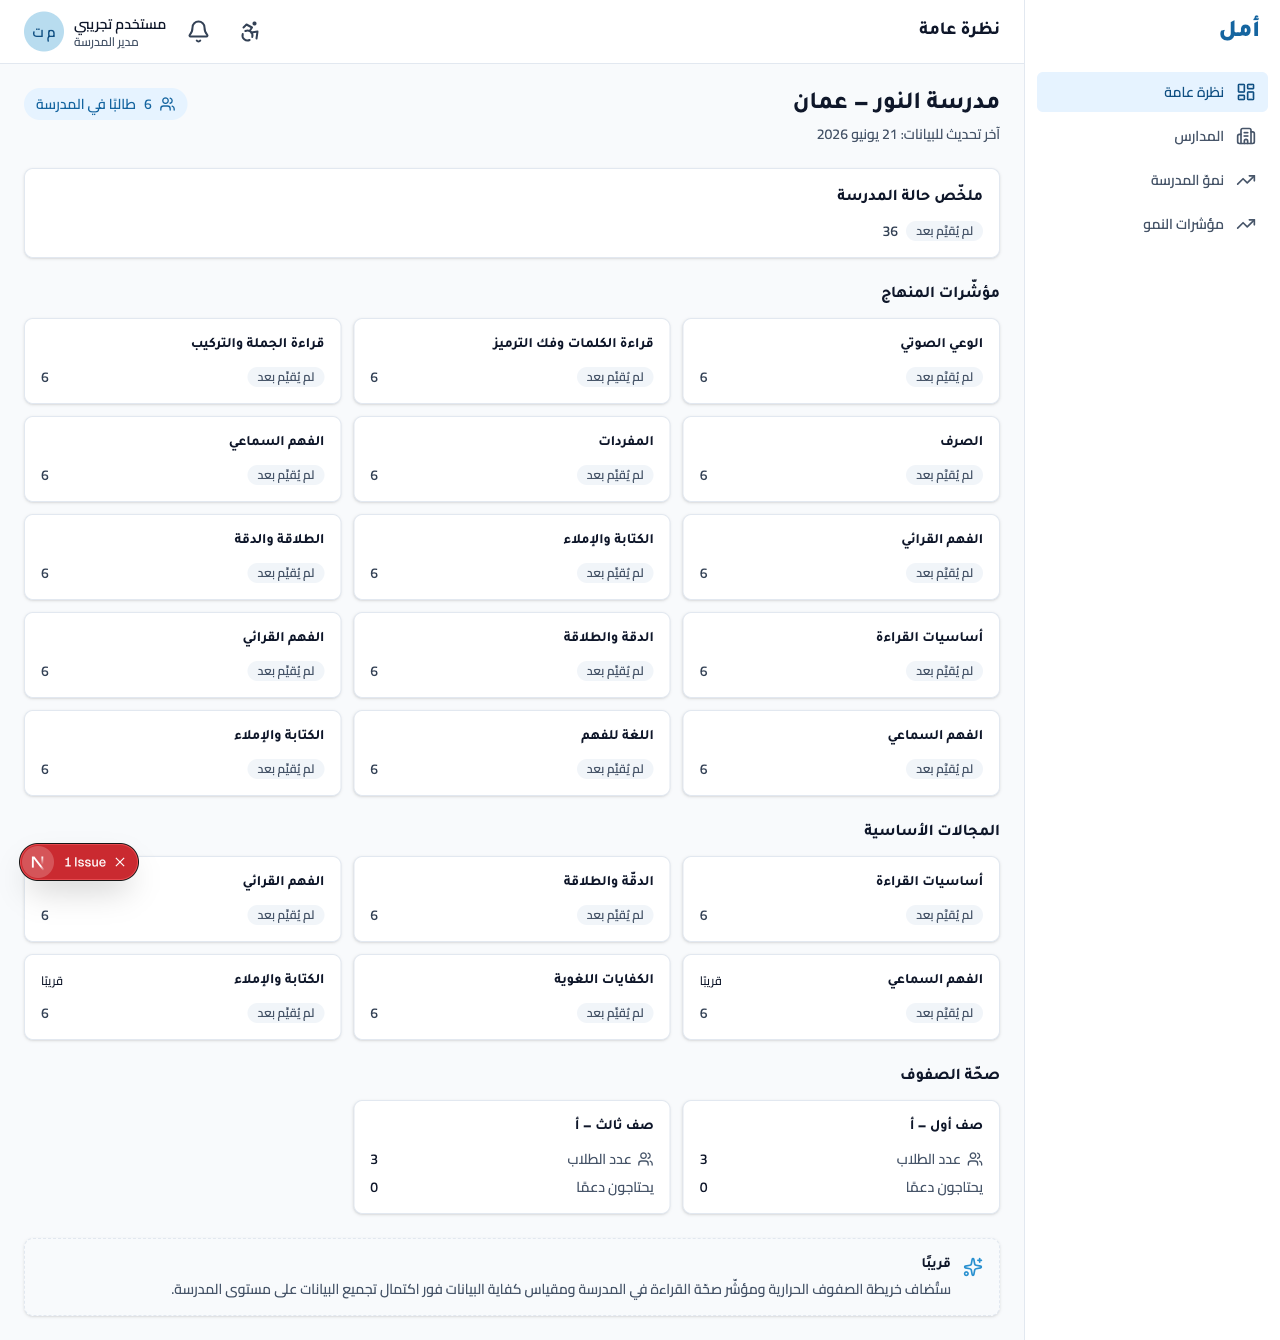
How to:
- Scan the macro-domain grid for the school’s standing per domain.
- Read the class-health section for per-class counts.
- Open accessibility and notification controls from the top of the page.
Schools
For a single-school principal, the schools entry resolves straight to that school’s overview — there is nothing to choose.
Growth over time
The growth screen shows each of the six macro domains across the assessment windows (beginning / middle / end of year), so you can see movement over the year at the status level.
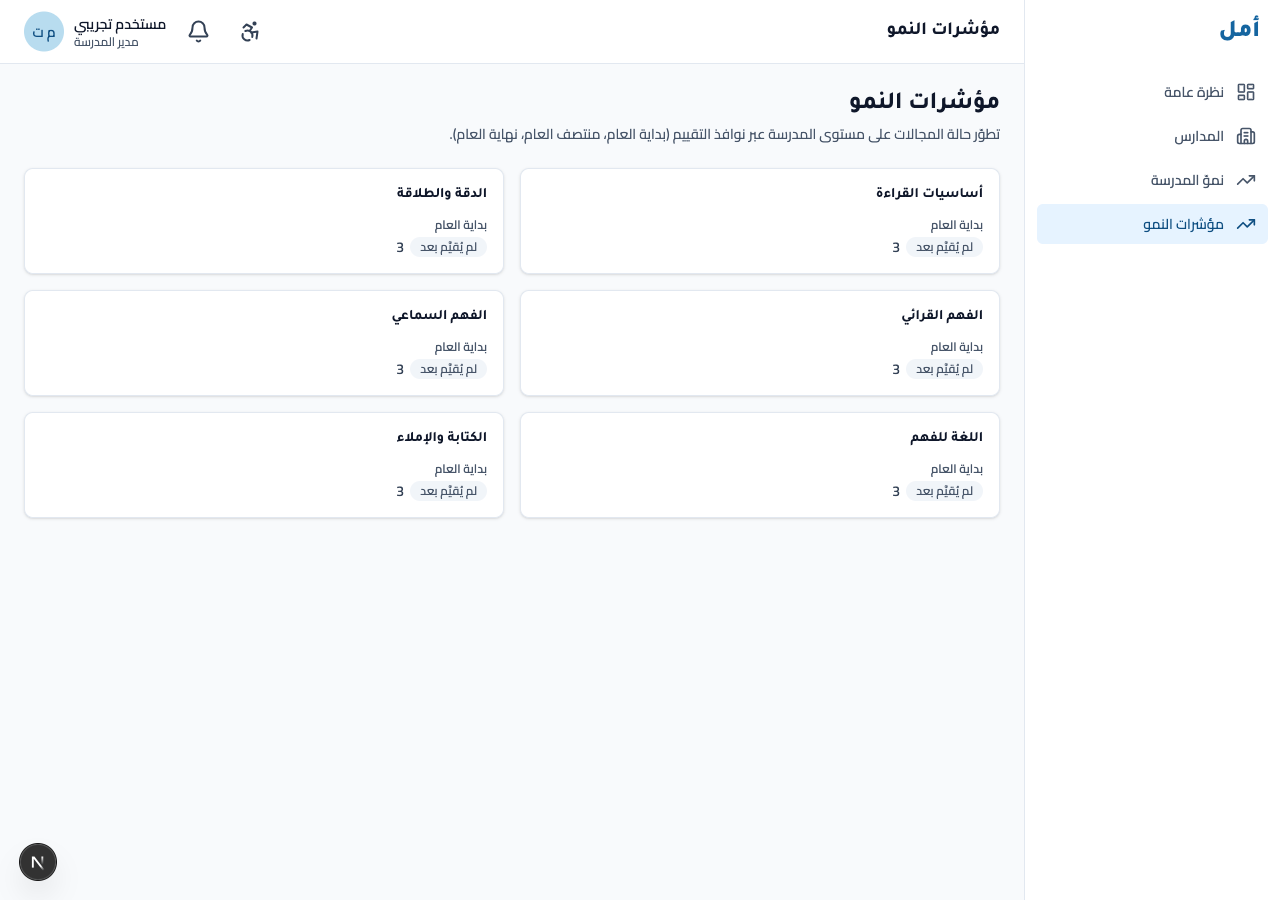
How to:
- Read each macro domain across the available windows.
- Compare the windows to see where the school is moving.
Leaderboard (growth, not ranking)
The leaderboard celebrates measured growth and level progress across the school, with by-class counts. It uses growth language throughout — never ranking vocabulary.
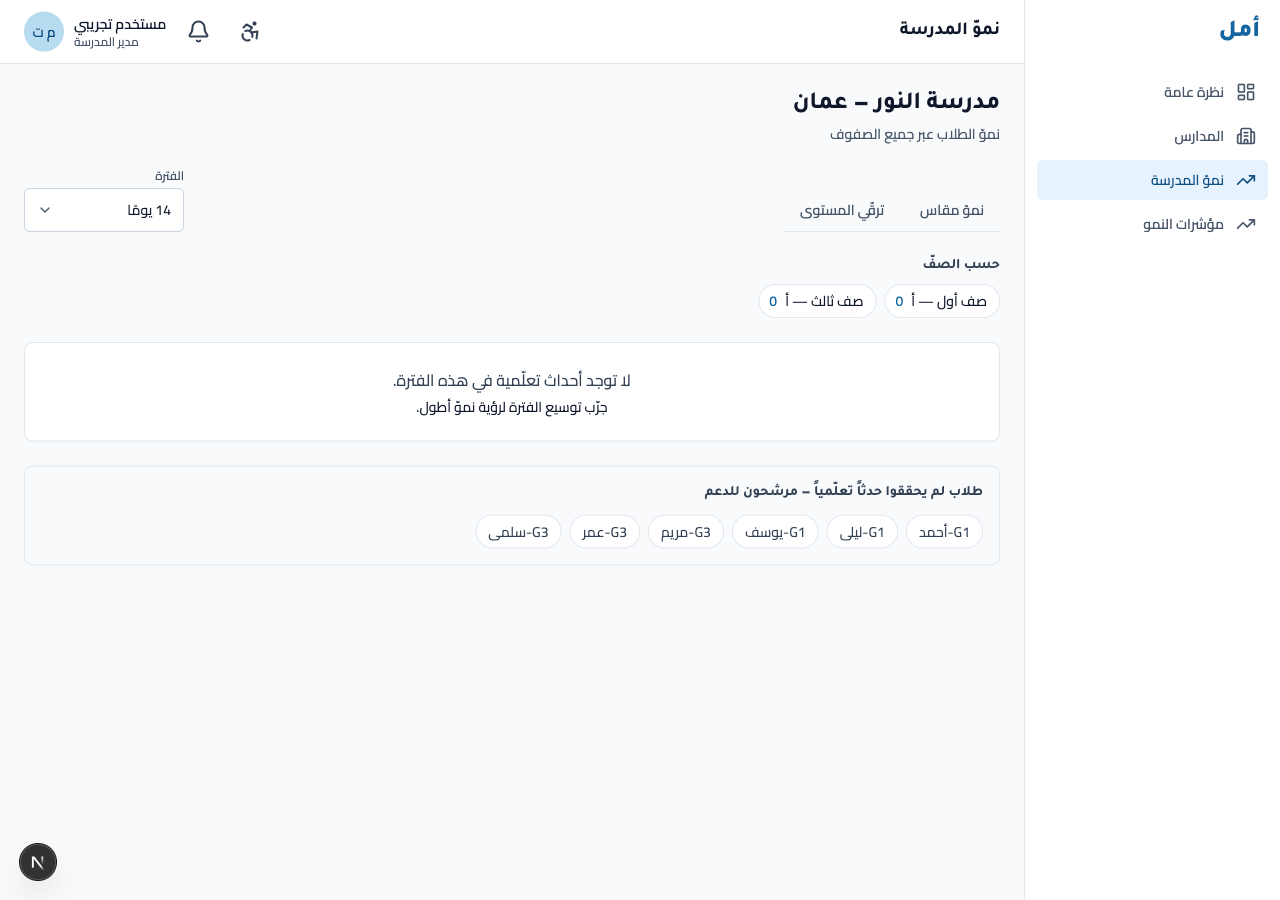
How to:
- Switch between the measured growth and level progress views.
- Choose a period (7 / 14 / 30 days).
Some panels — the data-sufficiency gauge and the detailed heatmap — are marked coming soon and will populate as a school accumulates more assessment data.
On phone and tablet
- On a wide screen the navigation rail sits on the right.
- On a phone you navigate from a fixed bottom tab bar; the overview cards reflow from two columns into a single column.
Every status stays per-measure or per-macro-domain at all sizes — there is never a single school-wide percentage.